Copyright VirtualSim 2004-2020 - All rights reserved
Graphs
Graphs are combining input curves and output charts capabilities to increase the parameters definition and conveniently display integrated data at runtime with line curves.
Charts and Curves are stored inside Containers (like Models).
Environment
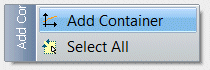
First, create a Graph container using either the button on the vertical toolbar, or with the context menu (mouse right click)
Give a name to this (graph) container (basically, a container will gather charts and curves of the same type or usage).
Then open the container or double click the symbol to get inside.