Chart
Chart is a runtime drawing object intended to provide to attached entities, simple mechanism to store data in runtime and have them displayed during the run or after the simulation end. Chart is typically used for Data Analysis as it can be perfectly combines with the Batch Mode.
A Chart is given to entities that have capabilities to write data, altogether, into a unique file that will be kept open for the duration of the simulation. It will be close and simulation end.
The Chart can load the last relevant file and display its content, during the runtime or after.
It also can load any other chart file produced by previous simulation runs.
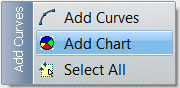
To add a new Chart to a Container (once inside), use the

button on the vertical toolbar or use the context menu (mouse right click)
Give a name to the Chart.
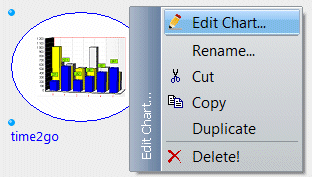
When a Chart is selected:
: change the name of the current selected Chart
: copy the Chart to the clipboard and remove it from the current Container
: copy the Chart to the clipboard
: do a copy then paste on the same Container
: remove the selected Chart from the Container and Database.
When a Chart is defined, the purpose is to be fed by data to display. The simulation engine, at runtime, produces a cht file in the database directory itself. Every new run produces a new cht file whose name format is <scenario name>_<uniq number>_<database name>.cht
From the source code of any vsTASKER entity that has been registered to the Chart, do the following:
|
E:setChartData("time2go", X, Y);
|
Where E: stands for the Entity, time2go is the name of the Chart (could also be <graph name>::<chart name>) and Y value on the X axis.
You can get the full API in /include/engine/vt_charts.h
An entity must be registered into a Chart in order to be able to use it. At design time, entity must be manually added into the Chart using the button

.
If entity is created at runtime, it must self register using specific code:
|
R:graphs->registerTo("myChart", this->entity);
|
The runtime data file will then need to be loaded manually in order to be displayed as the GUI will not be informed.
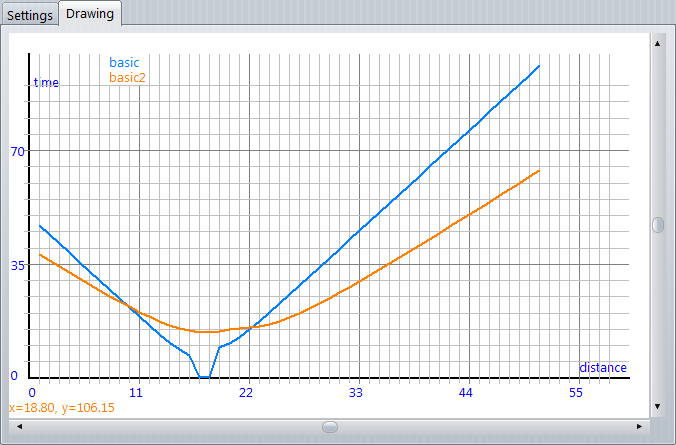
During the simulation run, open the Chart and click on the Drawing tab to see the actual content of the file as being written by the registered entities.
Each curve will represent the data written by each entity with its own color.