Copyright VirtualSim 2004-2020 - All rights reserved
Properties
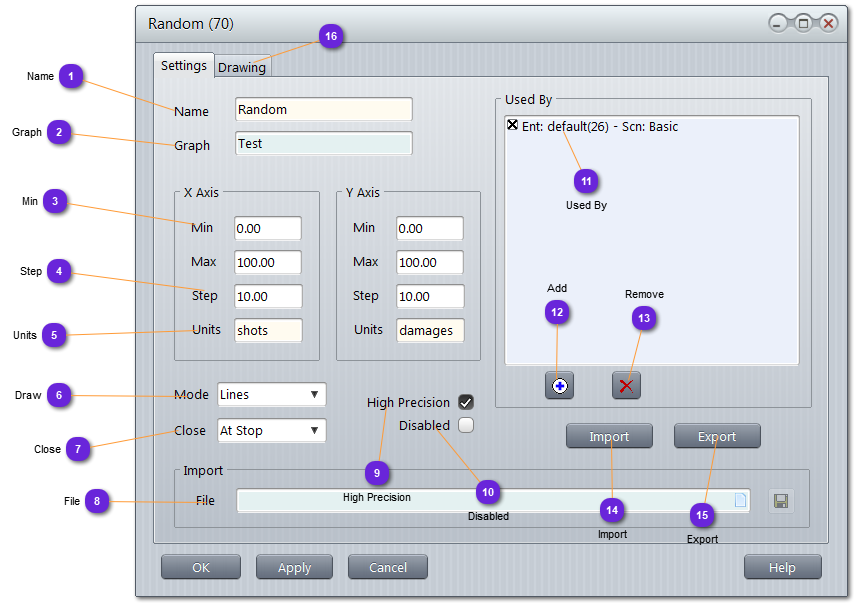
Name
Name of the Chart that could be duplicated as the name of the Graph (container) must prefix the Chart name to give the full name needed by the finder.
Itis allowed to give the same name to different Charts in different Graphs. The unique name to find them will be the concatenation of the Graph name and the Chart name (separated with two colons), otherwise, only the first Chart with the matching name will be returned.
At Stop: data file will be closed at simulation stop. This choice is good when one file per run is requested.
At Exit: data file will be closed at exit. This choice is good with batch, when several run (start and stop) are requested to provide the data to the file.
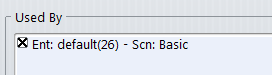
List all the Entities from all the Scenarios that are entitled to send data to this Chart, at runtime.
All Charts are private. An Entity not registered cannot record anything to a Chart, even if the data is sent.
When a listed entity is unchecked, the corresponding data will not be displayed on the Data panel, but at runtime, the entity will still be able to fill in new data.