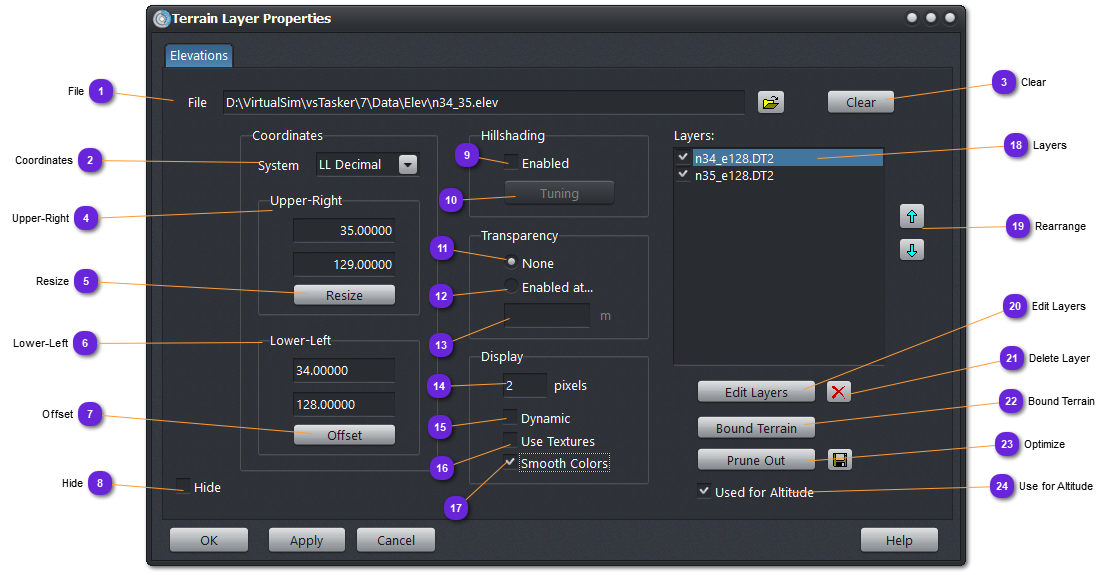
Set here the minimum size of a visible plot. The lower the value, the more accurate the drawing and the more CPU is required (drawing might be jumpy for big elevation database).
This value does not influence the altitude query. It is only for display.
If checked, the pixel size will be automatically computed according to the size of the database and the zoom level. The higher the zoom, the higher the accuracy for the display.
If checked, the elevation plots for each tile are not drawn. A texture file is used instead. Use this with big elevation database to increase drastically the drawing process.
First time the option is used, vsTASKER will automatically build the textures for all the elevation tiles (15). Might take some time. Done once.
When this flag is raised, the plot colors are interpolated according to altitudes of the bounding layers.
ie: if layer 1 for altitudes [0..10[ is green and layer 2 for altitudes [10..20[ is yellow, plots for altitudes [5..10[ will have colors interpolated between green and yellow (layer 1 & 2) while plots for altitudes [0..5[ will have colors interpolated between layer 0 & 1 defined ones.