To properly display this page you need a browser with JavaScript support.
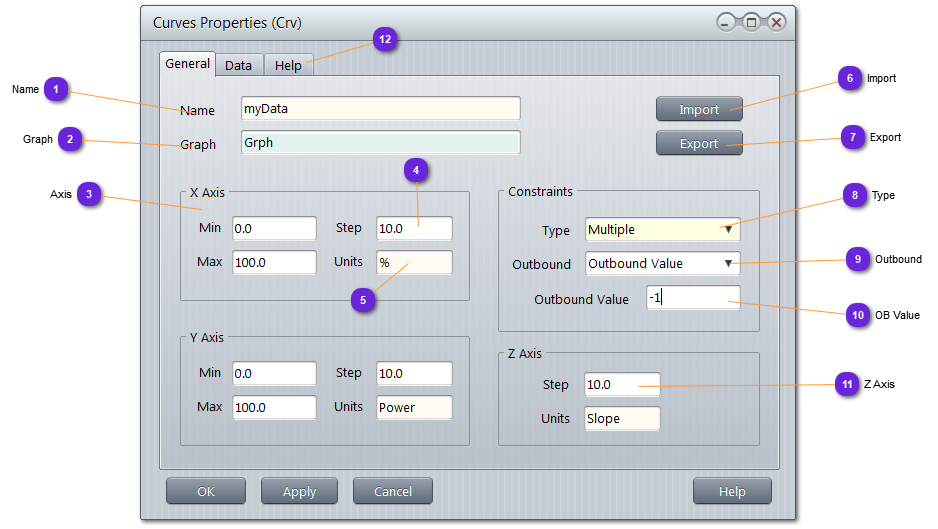
Name Name of the Curves that could be duplicated as the name of the Graph (container) must prefix the Curve name to give the full name needed by the finder.
It is allowed to give the same name to different Curves in different Graphs. The unique name to find them will be the concatenation of the Graph name and the Curve name (separated with two colons), otherwise, only the first Curve with the matching name will be returned.
Graph Name of the Graph container that holds the current Curves.
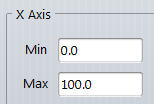
Axis X (horizontal) and Y (vertical) axis setting are used to draw the Curves canvas.
Min and Max values are boundaries for all curves. Use float values.
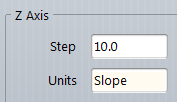
Step This value is used to draw the grid. It indicate the value between two grid lines (vertical or horizontal).
Do (max-min)/step to guess the number of lines that will be displayed.
Should not be zero.
Units This string value is only used for display to give a meaning to the value used in X or Y axis.
Import Use this button to import a previously exported Curves in /Data/Shared.
An exported Curves has extension .crv
Export Use this button to export a Curves for reuse or share between databases or users.
The Curves is exported by default in /Data/Shared but can be saved in any directory or support.
An exported Curves has extension .crv
Type Specify here how many curves will be defined:
Single : only one curve will be available. No Z value then.
Multiple : several curves will be available, all with a unique Z value.
Single curve is for simple data, like the mean temperature (Y) over the year, from January to December (X).
On this same example, if the data is available, Multiple curves will provide temperatures per year (Z), from let's say 1990 to 2010.
Outbound Specify here the strategy for the function returning the Y value (given X and maybe Z), when X (or Z) is below Min or above Max :
Extrapolate : use the slope of the curve to compute the projected value.
Last Valid : take the first or last Y value and returns it. No extrapolation.
Out bound Value : returns the user value defined in (10)
OB Value When out bound strategy is set to out bound Value (see above), enter here the value that will be returned whenever X (or Z) is below Min or above Max .
Z Axis Same as for X and Y Axis, but for the Z axis.
Only available for Multiple Curves (8).
Help Any description of the Curves can be put here and will be used for the automatic document generation (see
Make Documents )